Tagged : Las Vegas market stats

There are currently 5 blog entries matching this tag.

 Las Vegas real estate stats

Now that the summer heat has calmed down and the temperatures are more conducive to shopping for that new home, we're starting to see Las Vegas real estate sales on the rise. 

On hand property inventory is hovering just under 3 months, which may indicate some apprehension about listing. This shouldn't be a concern, the market is full of serious buyers just waiting for that perfect home. Interest rates are very favorable, but slightly on the rise, which means if you're considering a new purchase, the timing is now.

We're also seeing more first-time buyers this Fall. Entry level homes or condos in good condition are selling quickly.

Las Vegas Real Estate Stats

Here are the latest stats for Las Vegas real estate in October 2019:

Las Vegas

1,598 Views, 0 Comments.

Las Vegas is Trending Toward a Buyer's Market

Las Vegas buyers market

Overall, this October demonstrated a nice recovery from the slower months in late summer. One big change is apparent; there are definite signs that the Las Vegas real estate scene is trending toward a Buyer's Market. This is pretty big news, considering the lengthy Seller's Market that has sustained itself for the past year. 

Here are some of the indicators that the market is tilting slightly more favorably toward buyers:

  • Months supply of inventory has been on the rise each month, and up 21.7% from October 2017
  • An increase in new listings
  • Number of closed sales decreased -18% since the spring
  • The number of days on market is on the rise, 32 in October and as low as 25 last July
  • The
2,447 Views, 0 Comments.

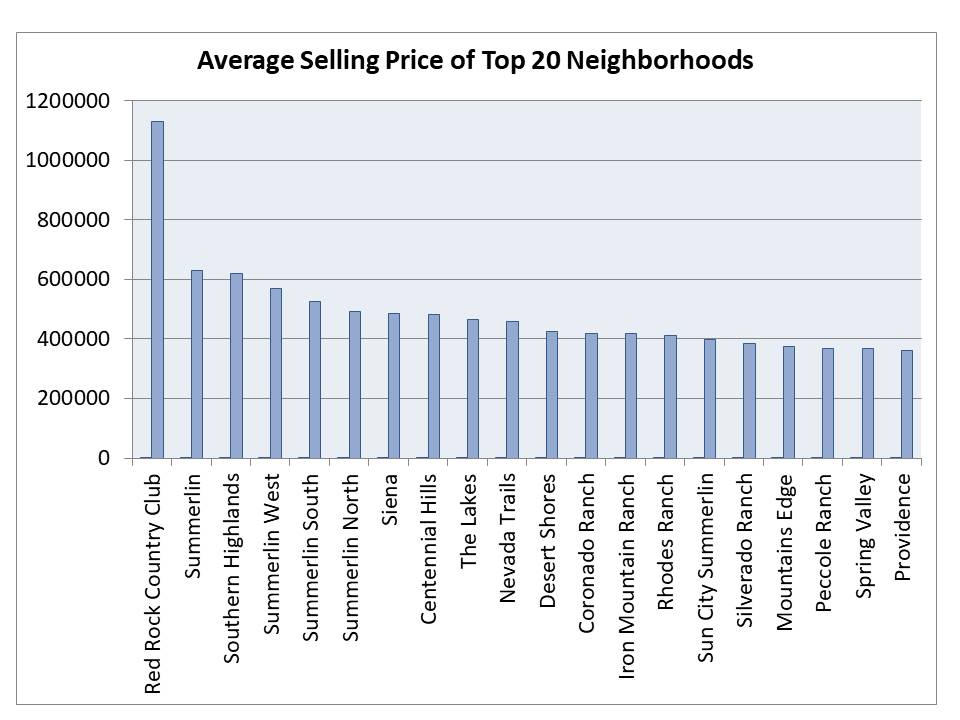
We looked at the top selling neighborhoods in Las Vegas YTD as of June 30, 2018 and have come up with the list below. Average prices have increased by leaps and bounds, notice that none of the top sellers are below $350,000. SummerlinMountain's Edge and Southern Highlands are consistent front runners for high performing real estate sales. You can also view listings in all major Las Vegas Neighborhoods.

Top Selling Las Vegas Neighborhoods 2018

Top 20 Selling Las Vegas Neighborhoods by Volume & Average Price

Click your desired neighborhood to view current listings.

Neighborhood # of Sales YTD Average Selling Price
Summerlin 313 $629,817
Mountains Edge 216 $375,317
Southern Highlands 184 $619,543
Summerlin West 140
1,833 Views, 0 Comments.

After a hot, quiet summer, September and October real estate sales in Las Vegas are through the roof! A continuing trend of low housing inventory levels means it’s a great time to sell your Las Vegas home.

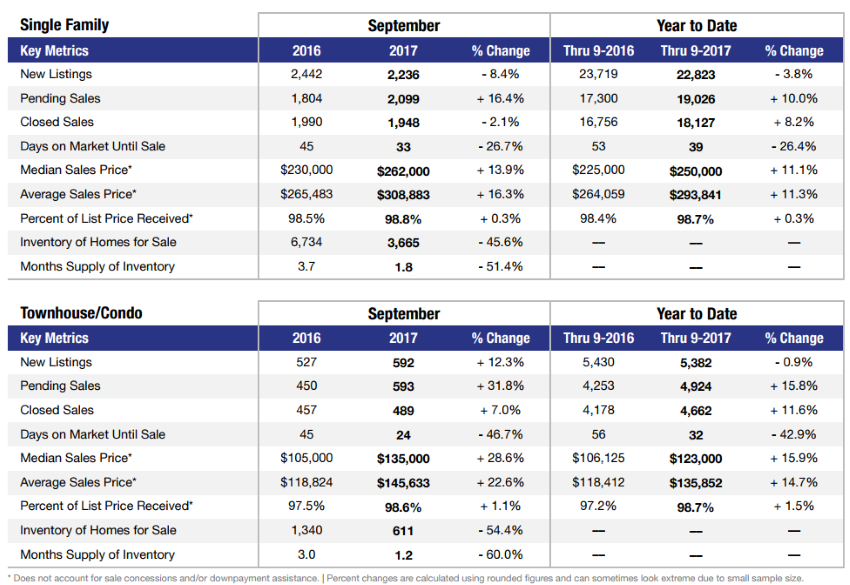
September 2017 stats for Las Vegas real estate

Low Inventory

According to the Greater Las Vegas Association of Realtors (GLVAR) monthly report for September, there are only 1.8 months’ worth of inventory on single-family homes. Real estate agents accept that a six-month supply is deemed a normal volume for a balanced real estate market, so this is a seller’s market right now.

For this past September, there were 45% fewer homes on the Vegas market than at the same time last year.

Fewer homes on the market means Las Vegas home sellers can usually get a better return on their house

2,152 Views, 0 Comments.

This is a Great Time to Sell Your Las Vegas Home

Selling a Las Vegas home

An inventory shortage of homes for sale in Las Vegas means it’s a great time to sell your Las Vegas home or condo ­– if that’s something you’ve been thinking about recently.

With the Greater Las Vegas Association of Realtors (GLVAR) latest market report, for the month of July, listed inventory is down a whopping 45.2% from the same time last year, it’s certainly a seller’s market in Sin City right now.

With inventory levels at an ultra-low 1.9 months right now, the President of the GLVAR, David J. Tina, noted that a six-month supply is normally thought of as enough homes for a balanced real estate market, but added homes and condos in Las Vegas are really selling quickly, so the inventory

2,150 Views, 0 Comments.